Introduction
This article looks at different techniques to analyse joiners and leavers using Web Intelligence. Analysing joiners and leavers is where you need to understand the change in membership of a set, for example, products moving in and out of your top 10 sales. If you are able to identify which key products that are dropping in sales you can then adjust your marketing strategy to reverse the trend.
Other scenarios include
- Customer analytics – customers can be categorise in terms of gold, silver bronze to indicate whether the customer generates high, medium or low revenue. We can then use joining and leaving analysis to identify which customers are moving between these groups
- HR analytics – analysis of employee turnover or once identifying joiners then analysing this group for diversity metrics, for example, is a campaign to recruit more female members of staff working?
- Healthcare – analysis of people by age group taking or dropping private healthcare
Overview
The screen shot below is of a Web Intelligence report that is displaying sales of product lines in the years 2005 and 2006. It also displays which of the products that were sold in 2005 are no longer being sold in 2006 (leavers), the products sold in 2006 that were not sold in 2005 (joiners) and which products were sold were sold in both years (stayers).
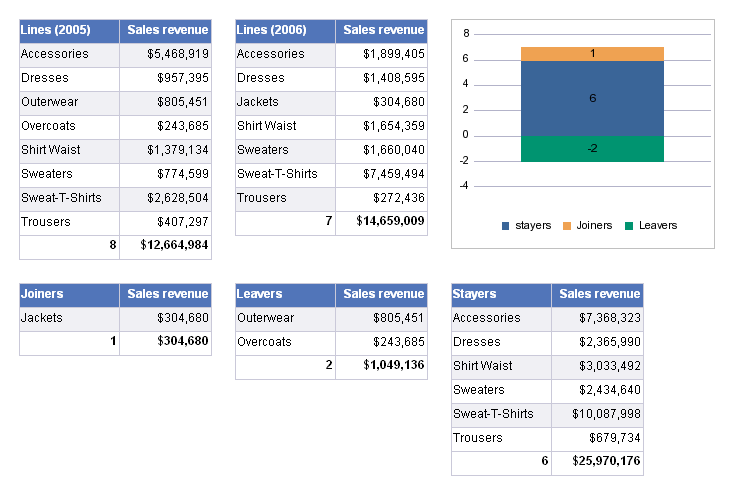
There are various ways to interpret this information. For example one of the things to note from the data above is that although sales increased from 12.6 million to 14.6 million we lost a potential further sales of just over 1 million due to outerwear and overcoats no longer selling in 2006. This is the sort of insight that can be gained from analysis of joiners and leavers.
So how we can build this report using SAP BusinessObjects Web intelligence? Below is a walk through example and the version being used here is XI3.1.
Identifying Joiners and Leavers in the Report
Our workflow here is to bring in both sets of data and then use Web Intelligence to identify the joiners and leavers. Unfortunately there isn’t a built in, “single click” function to do this but the method required is fairly straight forward.
We will follow a worked example step by step,
- First create a new query using the eFashion universe.
- Select Lines, Year and Sales revenue objects.
- Add query filter: Year = 2005 and Sales revenue greater than 240,000
- In the query properties update the query name to “LastYear”
- Duplicate this query and change condition to Year = 2006 – keep the Sales Revenue greater than 240,000 filter.
- Name this query CurrentYear
- Run both queries
The condition for Sales revenue greater than 240,000 is there just so that we actually have a difference between the list of products sold in the two years. Ideally I would have liked to use a top 10 products query for both years however it is not possible to do a ranking query against Microsoft Access where our eFashion data is held. In the XI3.1 release you can execute database ranking queries against SQL Server 2005 (using OLE DB connection), Oracle, DB2, Terradata and Redbrick.
We now can create our report, first we need to manage merged dimensions.
- Click the Merge Dimensions icon and remove year from the list of merged dimensions so that we are only merging on the Lines object.
- Open document properties and uncheck “auto-merge dimensions”
- The “extend merge dimensions” option should also be unchecked.
We need to work on objects from the two queries separately and so to make things easier we display the objects by query (rather than alphabetically) in the data tab.
If we start with a blank report we can build up the required display,
- First add a new table using the objects [LastYear].[Lines] and [LastYear].[Sales revenue]
- In the footer of the table add a count of the [Lines] object and sum of [Sales revenue]
- Update the header and enter the formula =UniqueNameOf([LastYear].[Lines]) for the header of the product lines column so that we display the year: “Lines (LastYear)”
- Beside this table add another table exactly the same but using objects from the [CurrentYear] query. Update header and footer as before.
We should have a report that looks like the screen shot below
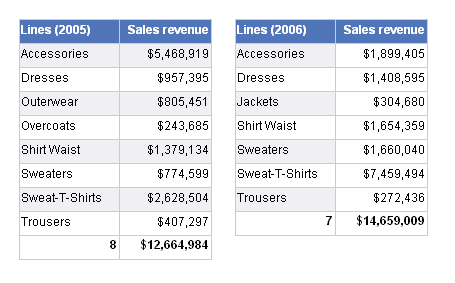
By looking at these tables we can see that the product line for Jackets is a joiner in 2006 as it doesn’t appear in the 2005 table and we also see that outerwear and overcoats are leavers as they are not in the 2006 table.
We now want to create three tables displaying joiners, leavers and stayers. First we need to create new variables.
- In the Data tab change the display to arrange the objects by Query.
- Right click over Variables node and select Create variable
- Name the variable “Joiners” and define the formula as,
=Count([Lines]) – Count([LastYear].[Lines])
- Click OK to save this variable and create a new variable called “Leavers” with formula,
=Count([CurrentYear].[Lines]) - Count([Lines])
Note, this formula is reversed to give the quantity of leavers as a negative value.
- Save this and create our last variable “Stayers” with formula,
=(Count([CurrentYear].[Lines])+Count([LastYear].[Lines]))-Count([Lines])
Now we can use these in the report,
- Add a new table to the report below the other tables and add the objects [Lines] and [CurrentYear].[Sales revenue]. Note, [Lines] is the merged object
- Add count and sum to the footer as before
- Select the table and display the filter pane.
- Add Joiners variable to the filter pane and define the filter as Joiners = 1
The table should now be filtered and displays a single row for Jackets.
- Add a new table beside this using [Lines] and this time [LastYear].[Sales revenue] objects
- Add count and sum to footer
- Filter this table using the Leavers variable with filter Leavers = -1
- Finally add a third table with [Lines] and for the second column we use the formula [LastYear].[Sales revenue]+[CurrentYear].[Sales revenue]
- Add count and sum to footer and filter using Stayers = 1
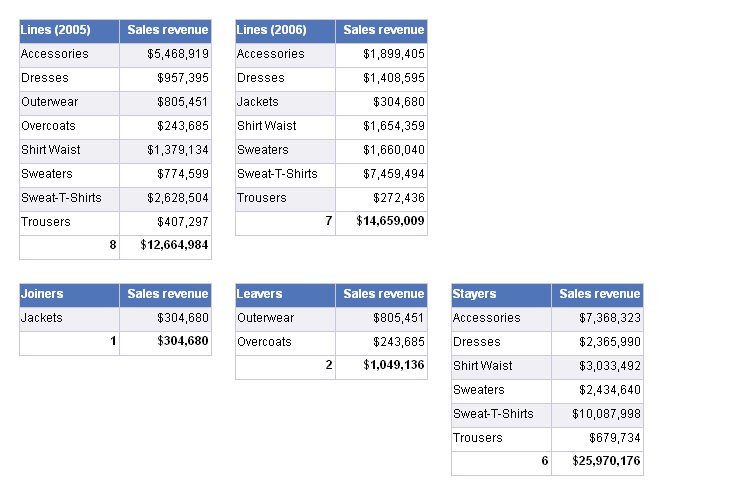
Our report should look like following,
To finish the report we would now like to add a chart displaying the number of joiners, leavers and stayers
- Add a new vertical stacked bar chart to the report to the right of the two tables at the top
- Add the thee variables Joiners, Leavers and Stayers to the measures area, leave dimension areas empty.
- Update chart format to neaten the display
We should now have our required report,
Alternative Technique
Rather than create 2 queries we could use a single query which may have better performance. In this case we then use the following formulae for identifying joiners, leavers and stayers,
Joiners
=Count([Lines]) - Count([Lines] Where ([Year]="2005") )
Leavers
=Count([Lines] Where ([Year]="2006") ) - Count([Lines])
Stayers
=Count([Lines] Where([Year]="2006") ) + Count([Lines] Where([Year]="2005") ) - Count([Lines])
One disadvantage is that we have to hard code the year value although below we can look at how to calculate this automatically.
Dynamic Analysis
In both above techniques we’re hard coding the 2 years – the first technique we hard coded year in the query and in the second we hard coded in the formula. It would be better if the report would automatically use current year and last year.
In the first case we can update the queries to use current year, last year. This article is a discussion of how to do this. The calculations in the report are unaffected by this change.
For the second technique where we used a single query things are a little more tricky. We can again easily update our query to select current year and last year however our formula for determining Joiners, Leavers and Stayers become more complex, for example, here is an updated formula for Joiners,
=Count([Lines]) - Count([Lines] Where ([Year]= Year(CurrentDate())-1 )
Note, in eFashion the data type of the Year object is String and so we need to convert this to a number in order for formula to work,
=Count([Lines]) - Count([Lines] Where ( ToNumber([Year])=Year(CurrentDate())-1 ) )
Identifying Joiners and Leavers at the Query Level
Above we performed out analysis in the report however we can also do this at the query level. This is useful if we are working with large sets, for example, if we have hundreds of thousands of customers and we just want to know who the joiners and leavers are then we don’t necessarily want to bring back full customer lists – we just want a list of those who have joined or left.
We have a couple of choices for how to do this at the query level. One option is to use the minus set operation and the second is to use a sub-query.
Set Operation
The set operation involves creating a query that returns the product lines sold in 2006 and then use the set operator “minus” to subtract the product lines sold in 2005. To do this in Web Intelligence,
- Create a new report and create a query that selects Product Lines
- Add a filter Year = 2006 and Sales Revenue greater than 240,000
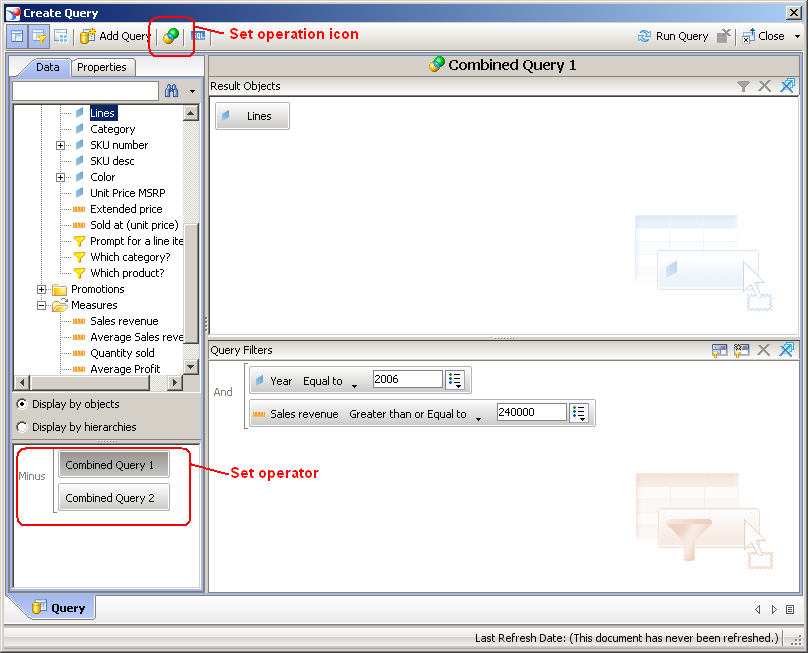
- Click the set operation icon (see screen shot below) and add filter: Year = 2005 and Sales Revenue greater than 240,000
- In the bottom right hand corner we should see two buttons for each of our queries beside which is the word Union. Double click this to change it to Intersection and double-click again to Minus
- Run query and we should get one row returned of Jackets – our joiners
This generates a straight list of product lines sold in 2006 that weren’t sold in 2005 – joiners. To identify leavers we reverse the sets – Product lines sold in 2005 minus product lines sold in 2006. We can do this by dragging the query buttons in the set operator panel so that Combined Query 2 is listed before Combined Query 1. Lastly to identify stayers we use change the set operator to “intersection”
We can then use the query on query technique to obtain further information using this query’s result set.
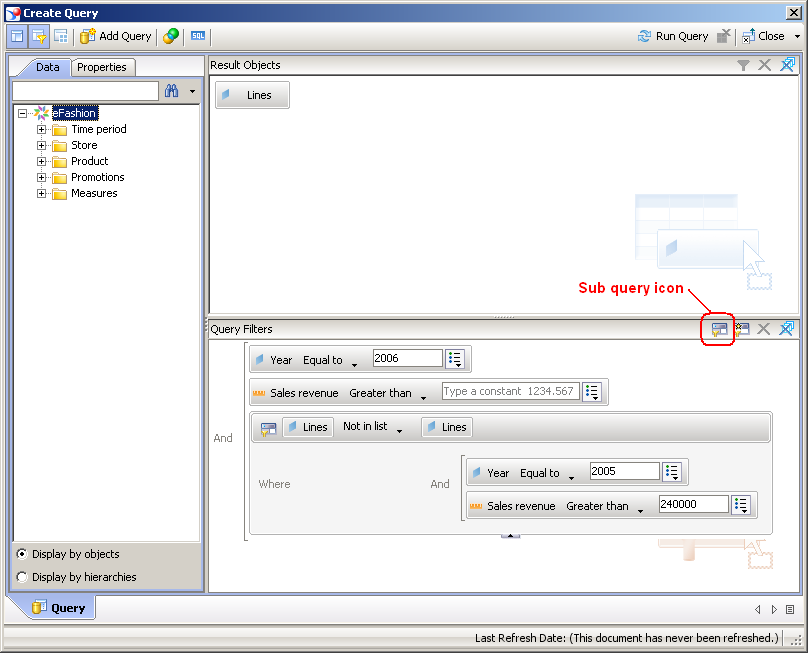
Sub-Query
Using a sub-query is where we create a query filter that says “filter for product lines where the product lines sold in 2006 are not in product lines sold in 2005”. To create this start as before,
- Create a new report and create a query that selects Product Lines, Sales revenue
- Add a filter Year = 2006 and Sales Revenue greater than 240,000
- Select Lines in the data panel and click the sub-query icon (see screen shot below)
- In the added sub query panel change the in List operator to Not In List
- Add Year to the filter area and change filter to Year = 2005
- Also add Sales revenue to the filter and set Sales revenue greater than 240,000
Run the query and again we should get one row returned of Jackets
For a display of leavers we again do the reverse where we create the query “filter for product lines where the product lines sold in 2005 are not in product lines sold in 2006” so main query filters for 2005 and sub-query filters for 2006.
I hope you found this article informative and that you now have a good understanding of the benefits of analysis movement of members to and from a set and that you can implement this using Web Intelligence.
Regards
AL

HI AL
This article is very clear to understand. I really appreciate your efforts and time.
Regards,
sree
LikeLike
Hello,
Thanks so much for the detailed explanation.
I have a similar issue. But this is very tricky compared to the situtation you have here.
I have basically 7 feilds where there will be 4 fields which will make the lines unique.
Transaction ID, XXXID, Party Name, Party Role
I have the same field for two different periods,
ihave to now compare and find what are the transactions that are there in the current month are not in previous month. I tried to use tthe minus option, Sub query, variables nothing wworked. I may have around 4 Lac rows or even more to do that comparision.
Please help.
Thanks,
NT
LikeLike
Hi Al,
I have similar kind of scenario with one more dimension in picture .
I am not sure if you still look this blog or not but still asking question.
Lets suppose you have one more date column in picture which is delivery date for the lines and assume for outwear and overcoats that date was 1st Feb 2005 and 1st march 2005.
Assume the entire horizon of delivery dates for year 2005 and 2006 is Jan/2004 to December 2007 so any line whose delivery date is not coming in this range will be considered as cancelled or New
Now in 2006 there is no delivery date for outwear but for overcoats it is now 1st Dec 2006, hence we will consider outwear as leaver but overcoat is still there(only the delivery date is changed).
how will I show the count of cancelled orders only , don’t want to show the moved orders
I want to delivery date in top row, and then count of Lines in 2005 and then count of lines in 2006 and then count of joiners and then count of leavers.
I tried above approach but as soon I drag delivery date and remove Lines, things got messed up, it shows moved order also as a cancelled one or new one.
Could you please suggest if such kind of design is possible?
Year Lines Count of lines Del Date Year Lines Count of lines Del Date
2005 Accessories 1 2-Jan-05 2006 Accessories 1 2-Jan-05
2005 Dresses 1 3-Feb 2006 Dresses 1 3-Feb
2005 Outwear 1 1-Feb 2006 Jackets 1 1-Nov
2005 Overcoats 1 1-Mar-05 2006 Overcoats 1 1-Dec-05
2005 Shirtwaist 1 4-Apr-05 2006 Shirtwaist 1 4-Apr-05
2005 Sweaters 1 2-Feb-05 2006 Sweaters 1 2-Feb-05
2005 Sweat tshirt 1 6-Jun-05 2006 Sweat tshirt 1 6-Jun-05
2005 trouser 1 8-Aug-05 2006 trouser 1 8-Aug-05
Joiners Count Del Date Leavers Count Del Date
Jackets 1 1-Nov-06 Outwear 1 1-Feb
Moved Orders Count Old del Date New Del date
OverCoats 1 1-Mar-05 1-Dec-05
What is Required:
Del Date 2-Jan 1-Feb 2-Feb 3-Feb 1-Mar 4-Apr 6-Jun 8-Aug 1-Nov 1-Dec
2005 1 1 1 1 1 1 1 1 0 0
2006 1 0 1 1 0 1 1 1 1 1
Diff(Simple subtraction) 0 -1 0 0 -1 0 0 0 1 1
Count of new orders(Joiners 0 0 0 0 0 0 0 0 1 0
Count of Cancelled Orders(Leavers) 0 1 0 0 0 0 0 0 0 0
Any suggestion over above mentioned scenario!!
LikeLike
hi
LikeLike
Hi Al,
I have similar kind of scenario with one more dimension in picture .
I am not sure if you still look this blog or not but still asking question.
Lets suppose you have one more date column in picture which is delivery date for the lines and assume for outwear and overcoats that date was 1st Feb 2005 and 1st march 2005.
Assume the entire horizon of delivery dates for year 2005 and 2006 is Jan/2004 to December 2007 so any line whose delivery date is not coming in this range will be considered as cancelled or New
Now in 2006 there is no delivery date for outwear but for overcoats it is now 1st Dec 2006, hence we will consider outwear as leaver but overcoat is still there(only the delivery date is changed).
how will I show the count of cancelled orders only , don’t want to show the moved orders
I want to delivery date in top row, and then count of Lines in 2005 and then count of lines in 2006 and then count of joiners and then count of leavers.
I tried above approach but as soon I drag delivery date and remove Lines, things got messed up, it shows moved order also as a cancelled one or new one.
Could you please suggest if such kind of design is possible?
Year Lines Count of lines Del Date Year Lines Count of lines Del Date
2005 Accessories 1 2-Jan-05 2006 Accessories 1 2-Jan-05
2005 Dresses 1 3-Feb 2006 Dresses 1 3-Feb
2005 Outwear 1 1-Feb 2006 Jackets 1 1-Nov
2005 Overcoats 1 1-Mar-05 2006 Overcoats 1 1-Dec-05
2005 Shirtwaist 1 4-Apr-05 2006 Shirtwaist 1 4-Apr-05
2005 Sweaters 1 2-Feb-05 2006 Sweaters 1 2-Feb-05
2005 Sweat tshirt 1 6-Jun-05 2006 Sweat tshirt 1 6-Jun-05
2005 trouser 1 8-Aug-05 2006 trouser 1 8-Aug-05
Joiners Count Del Date Leavers Count Del Date
Jackets 1 1-Nov-06 Outwear 1 1-Feb
Moved Orders Old del Date New Del date
OverCoats 1 1-Mar-05 1-Dec-05
What is Required:
Del Date 2-Jan 1-Feb 2-Feb 3-Feb 1-Mar 4-Apr 6-Jun 8-Aug 1-Nov 1-Dec
2005 1 1 1 1 1 1 1 1 0 0
2006 1 0 1 1 0 1 1 1 1 1
Diff(Simple subtraction) 0 -1 0 0 -1 0 0 0 1 1
Count of new orders(Joiners 0 0 0 0 0 0 0 0 1 0
Count of Cancelled Orders(Leavers) 0 1 0 0 0 0 0 0 0 0
Any suggestion over above mentioned scenario!!
LikeLike
Hi
the technique above considered 2 data sets and compared those two sets. the first set was the sales data for year 2005 and the second was sales data for 2006. when we compared the two sets we used the Product Line dimension.
If i understand correctly your requirement is same but for the Stayers category you have the extra requirement to identify the product lines where the Delivery Date is different.
I think the easiest approach would be two do the Merge Dimensions as above using just Product Lines – you may need to edit and remove Delivery Date dimension if WebI is automatically adding this. We only want to compare using Product Line. I think this is maybe where things aren’t working for you.
Then add a variable that compares the delivery date where if the delivery dates are different then return True otherwise False. You can then filter your report on this variable
LikeLike
Hi,
I was already using merge dimension. Actually I need delivery date too. Also if I compare delivery date then also I will not get the count of orders for that date which are pure cancelled orders not moved orders.
Anyway we have changed the way of representation and now we are showing Joiners/Leavers and Stayers separately.
Thanks,
R
LikeLike