Introduction
This article looks at how to create a histogram in Web Intelligence and makes use of input controls to allow the user to automatically adjust the histogram’s bucket size.
Histograms is a charting technique used to analyse the distribution of a set of data for example a business analyst may use a histogram to analyse the range of ages of the employees of a business. Or in manufacturing you can use a histogram to analyse how stable a process is.
A histogram is one of the seven basic tools of quality and is also used in Six Sigma and other business improvement methodologies.
How to Create a Histogram in Web Intelligence
First of all we’ll look at how to create a basic histogram in Web Intelligence and then look at how we can enhance this using input controls to allow a user to define the size of the histogram’s bucket.
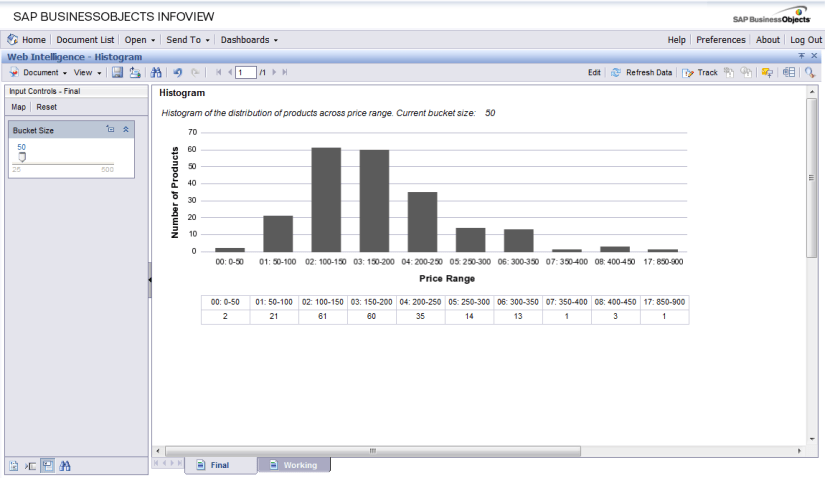
In our worked example below we’ll use the eFashion demo Universe and we’ll create a histogram that looks at the range of unit prices for the products available. Figure 1 displays the histogram we want to create.

This histogram displays the number of products for a set of price ranges: 0 to $100, $100 to $200 etc. and we can see that the majority of products fit in the $100-$200 price range.
Let us now look at how to create this Web Intelligence report.
Creating a Basic Histogram
To create a histogram
- Create a new report using the eFashion universe and in the query select the objects [SKU desc] and [Unit Price MSRP]
- Execute the query and you should be displayed a table of [SKU desc] and [Unit Price MSRP]
- Sort the table by [Unit Price MSRP]
Determine a Suitable Bucket Size
By examining the table we can see that the unit price ranges from $34.30 up to a maximum value of $852.50. From this we can decide what would be a suitable size for our buckets for the histogram and a sensible choice would be to have a bucket size of $100.
So we now need to determine for each unit price what bucket it should lie in and we can use a bit of maths for this.
-
- Add a new column to the right of the unit price column and enter the following formula in this column,
=Round([Unit Price MSRP];-2)
-
- This rounds the unit price to the nearest 100 dollars. Update the formula to the following,
=Round([Unit Price MSRP];-2)-100 + "-" + Round([Unit Price MSRP];-2)
which will give us a label that we can use for our histogram
-
- Click on the “create variable” icon to convert this formula to a variable and give the variable the name “Price Range”. Make sure the type of the variable is Dimension.
- Add another column to the table and enter the following formula,
=Count([SKU desc])
- Also convert this to a variable with name “Count of Products” and this is of type Measure.
- Now remove the [SKU Desc] and [Unit Price MSRP] columns so that you are just left with the two new variables. The table should automatically aggregate and look like figure 2 below.

- Now we can just right click over the table and select turn to a simple bar chart and we should have our histogram as displayed in figure 1 above.
Using Input Controls to Vary Bucket Size
Above we used the Round function to round the unit price to the nearest $100 however what if we want to use $50 bucket sizes? The Round function only allows us to round to a power of 10 so we need another technique.
We can then create bucket size labels that are then 0-50, 50-100, 100-150 etc however Web Intelligence treats these as text rather than number and so sorts them alphabetically rather than in expected numerical order. We can ‘fix’ this by prefixing the range with the bucket ID: “00: 0-50”, “01: 50-100”, “02: 100-150” etc.
Finally we want some mechanism where the user can easily vary the bucket size and for this we create a new variable that holds the bucket size and use an input control to vary this amount.
Let us look at how we can put this together in Web Intelligence,
-
- Create a new variable of type Dimension called “Bucket Size” and enter formula,
=100
- Update the Price Range variable to the following,
=FormatNumber(Floor([Unit Price MSRP]/[Bucket Size]);"00") + ": " +
 Floor([Unit Price MSRP]/[Bucket Size])*[Bucket Size] + "-" +
 (Floor([Unit Price MSRP]/[Bucket Size])+1)*[Bucket Size]
This is quite long but if we break it down it is fairly simple. First of all we’re replacing our hard coded bucket size with our new [Bucket Size] variable. We then divide the [Unit Price MSRP] by the [Bucket Size] and use the Floor function to determine bucket number. Finally we multiply this by [Bucket Size] to build our range label.
If our unit price is $187.50 then dividing this by 100 gives 1.875. Using the floor to remove decimals gives 1 and if we then multiply this by our bucket size we get 100. This is the lower limit of our bucket range and we easily get the upper limit by adding the bucket size to the result which in this example would be 200.
The FormatNumber function is used to prefix the bucket number before the range amount. So in our example we would get a final value of “01: 100-200”. Prefixing with the bucket number ensures that the data will always be sorted in correct numerically order.
Our histogram should now look like,

Now we can create a new input control to provide the user with a means to easily change the bucket size.
- Select the Input Control tab and click the New button
- Select [Bucket Size] from the list of objects and click next
- Choose Slider for control type and update the properties as follows,
Description:Set the size of the histogram bucketMinimum Value:25Maximum value:500Increment:25Default:100Operator:Equal To
- Save the report and view through InfoView and it should look like the screenshots below.

Conclusions
A histogram is one of the most basic types of tool used for data analysis and quickly allows you to view the distribution of data. In our above example on distribution of product prices we immediately see that the majority of products have a price of between $100 and $200 and very few expensive products.
We also looked at using Web Intelligence input controls to quickly update the display. Input controls were introduced in the XI3.1 release of SAP BusinessObjects Enterprise and can be used to create a more interactive interface.
