Introduction
The previous article looked at what moving averages are and how to calculate them. This article now looks at how to implement these in Web Intelligence.
The formula used here are compatible with the XIr3 version of SAP BOE however some formula may work in previous versions if available. We’ll begin by looking at how to calculate a simple moving average before looking at weighted and exponential forms.
Worked Examples
The examples below all use same data set which is of stock price data in an Excel file which you can download. The first column in the file is the day of the stock price and then columns of opening price, highest price in the day, lowest price, closing price, volume and adjusted closing price. We’ll use closing price in our analysis below along with the Date object.
Simple Moving Average
There is a couple of ways by which we can calculate simple moving averages. One option is to use the Previous function to obtain the value of a previous row. For example the following formula calculates a moving average on our closing stock price for a moving average data set of size 3,
=( [Close] + Previous([Close];1) + Previous([Close];2) ) / 3
This is quite a simple formula however it is obvious it is not practical when we have a large number of periods here we can make use of RunningSum formula and for a data set of size N we have
=( RunningSum([Close]) – RunningSum(Previous([Close];N)) ) / N
Finally we have a 3rd technique,
=Previous(Self) - Previous([Close];N)/N + [Close]/N
Which although more complicated it may have better performance as it is calculating the new value based on previous value rather than two running sums over the full data set. However this formula only works after the Nth point in the overall data set and since it refers to a previous value we must also set a starting value. Below is the full formula used for our stock price analysis where our moving average period is 15 days,
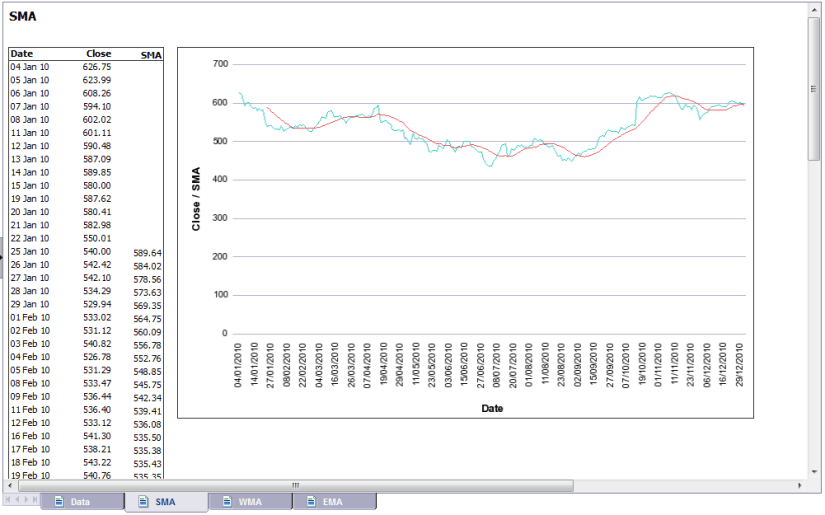
=If [Date]>'1/25/2010' Then
  Previous(Self) - Previous([Close];15)/15 + [Close]/15
Else If [Date]='1/25/2010' Then
  RunningSum([Close]/15)
The date 1/25/2010 is the 15th data point in our data set and so for this point we calculate a normal average using the RunningSum. For all dates beyond this value we use our SMA formula and we leave blank all dates prior to this date.
Figure 1 below is a chart in Web Intelligence displaying our stock price data with a simple moving average.
Weighted Moving Average
A weighted moving average formula with a period of 3 is,
=(3*[Close]+2*Previous([Close];1)+Previous([Close];2))/ (3*(3-1)/2)
As with our first simple moving average formula above this is only practical for a small number of periods.
I have not yet been able to find a simple formula that can be used for larger moving average periods. Mathematically it is possible but limitations with Web Intelligence means that these formulas don’t convert. If anyone is able to do this I would love to hear!
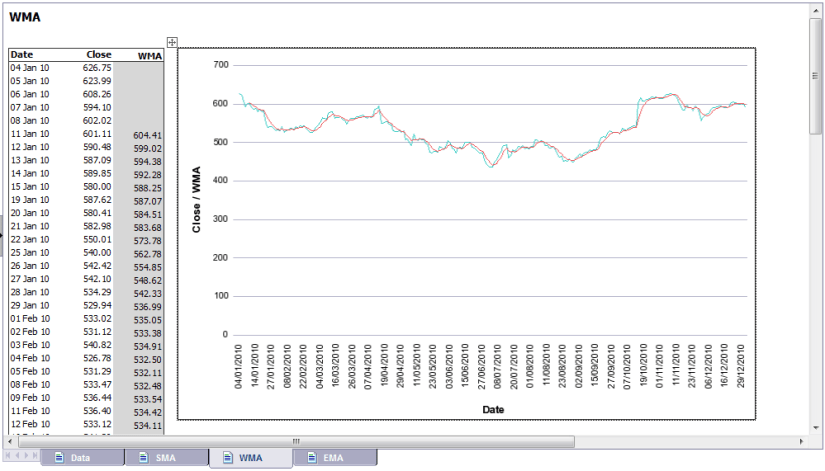
The figure below is an WMA of period 6 implemented in Web Intelligence.
Exponential Moving Average
An exponential moving average is quite straight forward to implement in Web Intelligence and so is a suitable alternative to a Weighted Moving Average. The basic formula is
=Previous(Self)+(0.3*([Close]-Previous(Self)))
Here we’ve hard coded 0.3 as our value for alpha. We only apply this formula for periods greater than our second period so we can use an if statement to filter these out. For our first and second period we can use the previous value and so our final formula for EMA is,
=If [Date]>'1/6/2010' Then
  Previous(Self)+(0.3*([Close]-Previous(Self))) Else Previous([Close])
Below is an example of an EMA applied to our stock data.

Input Controls
As our EMA formula doesn’t rely on the size of the moving average period and our only variable is alpha we can use Input Controls to allow the user to adjust the value of alpha. To do this,
-
- Create a new variable called ‘alpha’ and define it’s formula as,
=0.25
-
- Update our EMA formula to,
=If [Date]>'1/6/2010' Then
  Previous(Self)+([alpha]*([Close]-Previous(Self))) Else Previous([Close])
-
- Create a new input control selecting our [alpha] variable as the input control report object
- Use a simple slider and set the following properties,
| Property | Value |
|---|---|
| Minimum Value | 0 |
| Maximum Value | 1 |
| Increment | 0.03 |
| Default Value (blank) | 0.25 |
| Operator | Equal To |
- Once done you should be able to move the slider and immediately see the changes to the trend line in the chart
Conclusion
We looked at how to implement three types of moving average in Web Intelligence and although all were possible the Exponential Moving Average is probably the easiest and most flexible.
I hope you found this article interesting and as always any feedback is very welcome.

The trick to Weighted Moving Average (WMA) is you have to create a variable which represents the numerators of WMA (see Wikipedia for reference.) This should look like the following:
Previous(Self) + (n * [Close]) – ( Previous(RunningSum([Close])) – Previous(RunningSum([Close]]);n+1)
where n is the number of periods.
Then the actual WMA’s formula would be like this:
[Numerator] / (n * (n + 1) / 2)
where [Numerator] is the variable you created earlier.
LikeLike