In data platforms, Data Quality refers to the processes and solutions for measuring, monitoring and managing the quality of data being used by that platform and, in mature organisations, incorporate a feedback loop to the operational systems to improve levels of data quality.
Data Quality by Design is a method used in application development to address data quality up front, that is, to design features and functions that ensure a high quality of data is captured. This can be simple: data validation rules in online forms, or more complex: validating mobile numbers through SMS acknowledgment, for example.
It has the same philosophy as Security by Design where security features are baked into systems from the outset with the aim of preventing security incidents rather than having to react to security incidents after they have occurred.
This article describes an approach to implementing the principle of Data Quality by Design as part of application and system development.
Photo by Matt Sclarandis on Unsplash
Method Overview
Data is at the heart of practically all IT applications and systems which often deploy a range of validation and checking techniques to ensure accuracy of data. However it is too expensive and impractical to include validation methods for every single data item and so it is necessary to prioritise. Furthermore the validation can be simple and inexpensive or more robust and consequently more expensive – how do you decide which?
Too often it is after an application has gone live that users realise the need for data validation and so features are bolted on to prevent DQ issues in future but, of course, by then the damage may have been done.
The Data Quality by Design method aims to address this by using a risk-based approach to assess and identify which application data should be considered a priority for data validation and other data quality checks. Through impact analysis it also aims to quantify the cost of poor data quality and so provide a business case for the cost of developing complex features that prevent poor data quality.
Summary
The Data Quality by Design method has 5 key phases:
- Mobilise the Data Quality Team. Identify those involved and define their roles and responsibilities.
- Identify Critical Data Elements. Identify the data used by the application that is in scope for data quality governance.
- Define Data Quality Rules. Capture the Data Quality Rules that define what is high quality for the Critical Data Elements.
- Deliver Solutions for high Data Quality. Design features and functionality in the application that mitigate against poor data quality for the Critical Data Elements including use of Design Patterns and Standards
- Monitor Data Quality. Once features have been delivered to production implement ongoing monitoring of the Critical Data Elements to ensure continued high levels of data quality

Step 1: Mobilise Data Quality Team
DQ by Design is a team effort where the Data Owners and Data Stewards work with Solution Architects, Data Architects and Engineers to execute the process. If Data Owners and Stewards have not been established this work can be picked up by Data SMEs or other project stakeholders.
Data Owners are accountable for the overall quality of data that they own. They are typically a business resource who have a solid understanding of the business process and how data is used in that process. They also understand the analytical requirements of the data they own.
For DQ by Design, Data Owners are required to ensure that any solution is able to create and manage data of a sufficient level of quality. Data Owners are responsible for,
- Identifying the data in scope
- Performing the risk assessment to identify the Critical Data Elements
- Understands the lifecycle of the CDEs – where the data is created and its dissemination across the organisation
- Assisting the Data Steward to define Data Quality Rules
- Define the priority of the CDEs
Data Stewards work with the Data Owner to define the rules that identify what is an acceptable level of data quality. Data Stewards are responsible for,
- Defining the Data Quality Rules with assistance from the Data Owner
- Working with Business analysts or otherwise, define the functional requirements for the parts of the solution that ensure high level data quality for the CDEs
Data Quality as an integral part of Solution Development
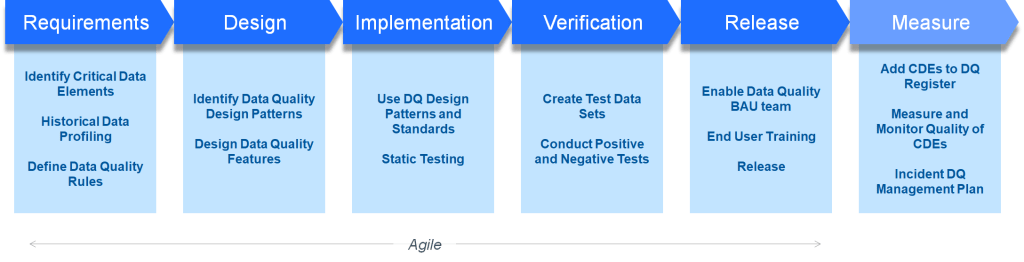
The focus of Data Quality by Design is on applications and operational systems and embeds data quality as a foundational aspect of solution design. It is an integral part of the Software Development Lifecycle (SDLC), implementing Data Quality Design Patterns and Standards to ensure consistency across our solutions.
The diagram below highlights key activities at the different stages of an SDLC where Data Quality work takes place. These include understanding the need for data quality in requirements phase through designing solutions that provide required data validation followed by standard testing and release. As with most cases method can be delivered as part of an agile delivery. The first task is to identify Critical Data Elements which is covered in next section.
Step 2: Identify Critical Data Elements
The risk based assessment mentioned earlier is used to identify critical data through assessing the impact poor data quality and the likelihood of that poor data occurring.
What is Critical Data
Critical Data refers to the data within an organisation that carries a significant risk to the operational and analytical functions as well as regulatory risk and reputational risk. Critical data typically has a high impact an organisations operations and decision making. It is often used in regulatory reports, analytical insights, to inform top level decision making and can be distributed to customers, external partners or governing bodies.
The term Critical Data Elements (CDE) to refer to the fields, attributes or whole entities that comprise the critical data
Critical Data Varies by Function
For an organisation’s customer service desk function, it is important to have accurate contact information – an incorrect phone number or email will prevent the customer service agent reaching the customer. This is an example of poor data quality impacting operations.
Incorrect phone numbers or emails have little impact analytical functions as they are rarely used for analysis however other data is used in analytics, for example, the customer’s demographics, and so poor data quality here will impact the analytical results.
A Risk Based Approach to Identifying Critical Data Elements
Data Owners are accountable for identifying the CDEs that are in scope for the system or function being designed. Input can be taken from other SMEs including business process designers and analysts, data architects and modellers, and data science and data analysts.
There are two factors involved in the risk assessment:
- the impact of poor data quality and
- the probability of poor data occurring
The probability can be determined through analysis of historical data or if this is not available can be estimated through discussions with data SMEs or comparison to similar systems.
The impact should be assessed against four perspectives:
- Operational Perspective – the impact of poor data on business operations, e.g. does it prevent or hinder a process being completed
- Analytical Perspective – the impact on data analysis e.g. does poor data limit analytical abilities or potential cause wrong conclusions to be made
- Regulatory Perspective – personal data is always is always considered as, at a minimum, GDPR legislation requires us to ensure the accuracy of the data we hold on citizens
- Reputation Perspective – this can be a little harder to assess but essentially will poor data quality for your organisation hit the news
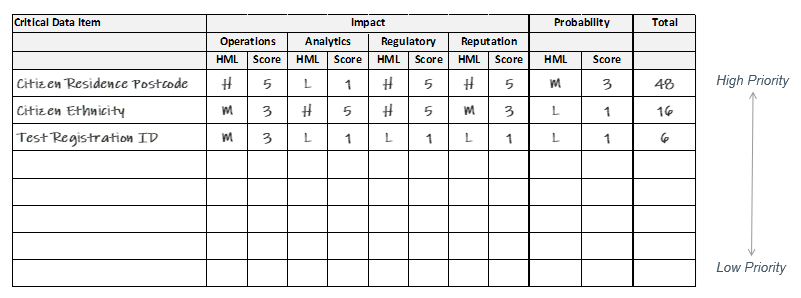
For each perspective a simple high, medium, low scoring mechanism can be used to quantify the impact of poor data quality.
Once done the scores are calculated as impact x probability and those that have the highest score carry the highest risk are deemed our Critical Data Elements.
Step 3: Define Data Quality Rules
After identifying critical data elements, data quality rules are defined for the CDEs.
Data Quality Rules are statements that specify how data should be processed in an organisation and are used to assess the quality of data. They are typically defined by Data Stewards and focus on ensuring the correct definition, valid ranges and associated business logic for data.
Use Data Quality Dimensions as guidance for defining a rule and the rule description should be clear, unambiguous and written in a natural language using terminology that the organisation understands. To avoid confusion all rules must be written to describe what good data is rather than what bad data is.
The following examples all use customer date of birth but are of increasing complexity.
- The customer record must have a date of birth
- The customer record must have a valid date of birth
- The customer record must have a valid date of birth where the calculated age of the customer is between 18 and 110 at the time of registration
- The customer record must have a date of birth as validated by official documentation such as a passport where the calculated age of the customer is between 18 and 110 at the time of registration
Data Quality Rule Principles
- DQ Rules should be clear, unambiguous and written in a natural language using terminology that the organisation understands
- A DQ Rule should be atomic
- A DQ Rule is measurable
- DQ Rules are centrally logged in a repository
- DQ Rules are subject to continuous improvement and review cycles
- A DQ Rule can only align to one data quality dimension
- DQ Rules can be executed at any point in a data’s lineage
Step 4: Delivering Solutions for Data Quality
There are many different methods that can be used to improve the quality of data captured by applications which range in simple, low cost methods to more complex and consequently expensive solutions. Often the expensive solutions require a business case and this is where using the risk assessment above can quantify the cost benefit.
User applications that capture data, such as online forms, are the most common areas where features to ensure high data quality are implemented. Other areas should also be considered, processes that transfer data between systems can contain features and functionality to mitigate against poor data quality.
Use the Data Quality Dimensions to identify different methods that can be used to mitigate against poor data quality. The three core dimensions of Completeness, Validity and Accuracy are the most common to use and consider these in order of complexity:
- Completeness. Making fields in an online form or data interface mandatory is a simple way to improves the completeness of the data but obviously it does not necessarily improve the validity or accuracy of that data. Making a field mandatory carries the risk that the person completing a form enters junk values particularly if being asked for sensitive information or contact information they are reluctant to divulge
- Validation. Moving up the complexity scale is data validation, and this in itself can range in complexity:
- Use a drop down list or radio buttons rather than free text fields.
- Validate the values entered. For example, when asking for a date of birth check the value entered is a legitimate date or more thoroughly check that there are no future dates or birth or dates of birth that will make someone old than 110 years say.
- Validate against a master data set. A common example is to validate an address against an authoritative database of address. These authoritative databases are provided by third parties or government bodies. In the UK, Ordnance Survey is one such example. Similarly, there are services that will validate that a provided mobile number is legitimate and in use.
- Verification. Checking an address against an authoritative database ensures that it is a valid address but that does not necessarily mean it is accurate. Verifying the accuracy of data can be the most expensive solution and often requires a business case. Verifying that a person is who they say they are will typically require offloading the check to an authoritative body such as a credit checking agency or government body. Accuracy of a mobile number can be checked by sending a confirmation SMS where the person providing the enters a code given in the SMS. This verifies that the number is both active and belongs to the person completing the form. A similar method can be used for emails.
Finally, it should not be overlooked that data quality can be improved through form design – consideration of the layout and flow of an online form or application as well as asking clear, unambiguous questions all help to improve data quality. Another key point is to inform the person completing the form how the data will be used. For example, many registration forms ask for a wide range of data and some people are reluctant to provide sensitive data and so deliberately enter junk values.
Step 5: Monitoring and Measuring Data Quality
Once solutions have been built to mitigate against poor data quality it is then necessary to measure and monitor the quality of that data on an ongoing basis to ensure that the data is retained at a high quality standard. Data Quality issues can still occur, and these can arise from various situations including,
- Enhancements to applications and systems that remove existing data quality control features
- Creation of new data entry points
- Data migration
- Changes to data pipelines
Measuring Data Quality
The data should be monitored on a regular basis; a common scenario is to measure the quality of the data as it is ingested into a data platform but it can be monitored in operational systems. The data quality rules defined above are used to measure the quality of the data.
Data failing a rule can be raised as an issue that requires remediation however more often thresholds are set where if the percentage of data failing a data quality rule falls below the threshold an issue is then raised.
Reporting on Data Quality
Data Quality Metrics are established through the measurement of data against the defined Data Quality Rules. There are 3 requirements to that make up a Data Quality Metric,
- The measurement itself which is the percentage of rows passing the data quality rule.
- A reporting period to define the frequency that DQ measurements are published. Data Quality measurement is applied to new and changed data within the period and to support this it is necessary to define what data field is used to define the reporting period. For example, the reporting period is defined date shipped rather than date received.
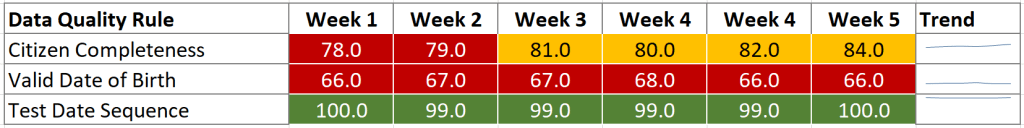
- A Threshold or RAG status established to define the acceptable tolerance for data quality An example of red, amber, green (RAG) status is acceptable (green) when 95% of citizen data to be complete, 80-95% completeness is tolerated (amber) but if it is less than 80% remediation is required (red). Additionally, an alert can be triggered when the data quality level falls into red where the Data Steward is notified via email or other mechanism.
Data Quality Metrics are then published on scorecards or reports. These would typically look like the screen shot below. In this example the table displays a new row for each Data Quality rule and for each rule the DQ Metric on a weekly basis.